
The Cloud Service Industry’s
10 Most Critical Metrics
Share this Post
The article does not include metrics such as Profits and Sales that are critical to companies in all industries; rather the focus is on metrics more specific to the Cloud Service Industry.
By tracking your metrics, you will dramatically improve your business results.
Why? Because not only is the old saying “If you can’t measure it, you can’t improve it” true, but visibility into your metrics allows you to identify WHERE you can make the easiest and most impactful improvements.
For each metric, we will answer the following questions:
– What is the metric?
– What is the average value of this metric?
– Why is this metric important?
Let’s get started…
1. Service/System Availability
What is this metric?
This metric is the percentage of time that a service or system is available. It is the ratio of time a system or component is functional to the total time it is required or expected to function. This can be expressed as a direct proportion (for example, 9/10 or 0.9) or as a percentage (for example, 90%). It can also be expressed in terms of average downtime per week, month or year or as total downtime for a given week, month or year. Sometimes availability is expressed in qualitative terms, indicating the extent to which a system can continue to work when a significant component or set of components goes down.
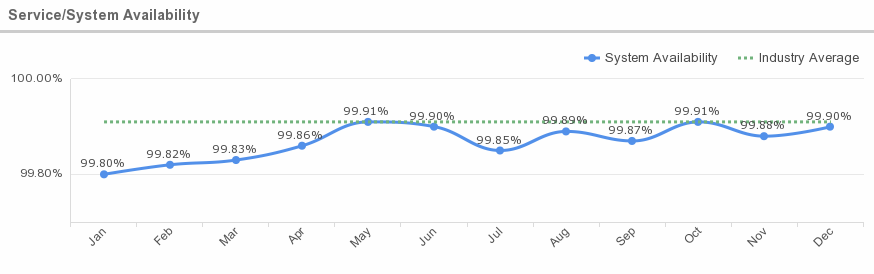
Average Availability: Preliminary results of cloud service availability, according to a global study conducted by IWGCR, show an average of 7.738 hours unavailable per year or 99.91% availability. The cost of these failures amounts to almost $285 million based on hourly costs.
Why is this metric important?
Availability is important. An uptime of 99.9% means 42 minutes of downtime per month during which you cannot provide service to your customers.
2. Reliability (Mean Time Between Failure and Mean Time To Repair)
What is this metric?
In the world of electronic components, reliability of repairable components is expressed as a combination of two parameters: Mean Time Between Failures (MTBF) and Mean Time To Repair (MTTR). For non-repairable components, it is expressed as Mean Time To Fail (MTTF). By analogy MTBF and MTTR can be, and often are, used as a measure of reliability of cloud services.
Mean time between failure (MTBF) refers to the average amount of time that a device or product functions before failing. This unit of measurement includes only operational time between failures and does not include repair times.
Mean time to repair (MTTR) is the average time required to fix a failed component and/or device and return it to production status.
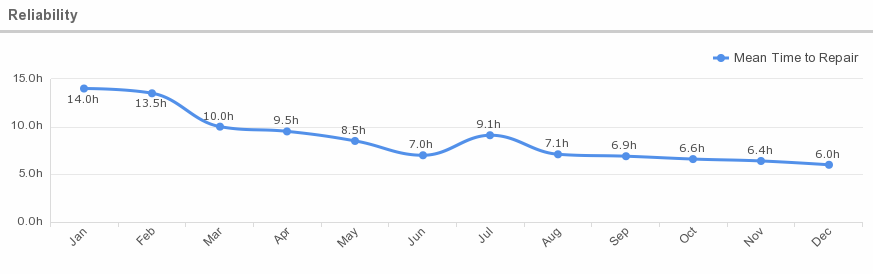
Reliability Tiers
ENKI describes cloud computing reliability this way: IT managers and pundits speak of the reliability of a system in “nines.” Two nines is the same as 99%, which comes to (100%-99%)*365 or 3.65 days of downtime per year, which is typical for non-redundant hardware if you include the time to reload the operating system and restore backups (if you have them) after a failure. Three nines is about 8 hours of downtime, four nines is about 52 minutes and the holy grail of 5 nines is 7 minutes.
Why is this metric important?
Hardware failure can lead to a degradation in performance to end-users and can result in losses to the business. A sound understanding of the numbers as well as the causes behind these failures helps improve operational experience by not only allowing us to be better equipped to tolerate failures but also to bring down the hardware cost through engineering, directly leading to a saving for the company.
3. Response Time
What is this metric?
What is this Metric?
This metric tells is defined as the time it takes for any workload to place a request for work on the virtual environment and for the virtual environment to complete the request.
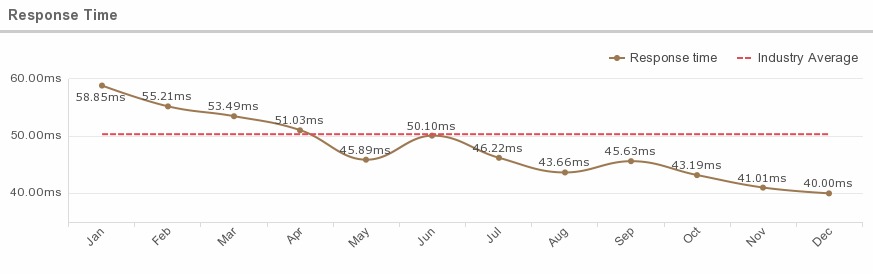
Average Response Time
According to a study published by Modern Education and Computer Science Publisher, when the user base and data centers are located in the same region, the average overall response time is 50.35 milliseconds. When the user base and data centers are located in different regions, the response time increases significantly, to an average of 401.72 milliseconds.
Why is this metric important?
Response Time gives a clear picture of the overall performance of the cloud. It is crucial, as it has an impact on application performance and availability.
4. Security
What is this metric?
Cloud computing security is the set of control-based technologies and policies designed to adhere to regulatory compliance rules and protect information, data applications and infrastructure associated with cloud computing use. The processes will also likely include a business continuity and data backup plan in the case of a cloud security breach.
Cloud security threats can be categorized as such:
| Category | Description |
| Security Standards | Describes the standards required to take precaution measures in cloud computing in order to prevent attacks. It governs the policies of cloud computing for security without compromising reliability and performance. |
| Network | Involves network attacks such as Connection Availability, Denial of Service (DoS), DDoS, flooding attack, internet protocol vulnerabilities, etc. |
| Access Control | Covers authentication and access control. It captures issues that affect privacy of user information and data storage |
| Cloud Infrastructure | Covers attacks that are specific to the cloud infrastructure (IaaS, PaaS and SaaS) such tampered binaries and privileged insiders. |
| Data | Covers data related security issues including data migration, integrity, confidentiality, and data warehousing |
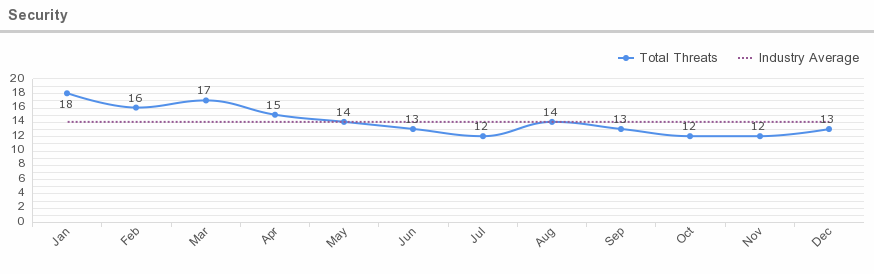
Average Security Threats
According to Skyhigh’s quarterly Cloud Adoption & Risk Report, 86% of organizations experience at least one threat incident per quarter. The average organization experiences 14 insider threats each month. These incidents include malicious users attempting to steal sensitive data, along with others who are simply negligent. Take the example of an employee who uploads sensitive data to a file sharing service in order to be more productive, not realizing the folder is shared with several third parties. While these actions are not malicious, they can have a significant impact on an organization.
Why is this metric important?
Because of the cloud’s very nature as a shared resource, identity management, privacy and access control are of particular concern. With more organizations using cloud computing and associated cloud providers for data operations, proper security in these and other potentially vulnerable areas have become a priority for organizations contracting with a cloud computing provider.
5. Throughput (aka Bandwidth)
What is this metric?
Throughput refers to the performance of tasks by a computing service or device over a specific period. For transaction processing systems, it is normally measured as transactions-per-second. For systems processing bulk data, such as audio or video servers, it is measured as a data rate (e.g., Megabytes per second). Web server throughput is often expressed as the number of supported users – though clearly this depends on the level of user activity, which is difficult to measure consistently.
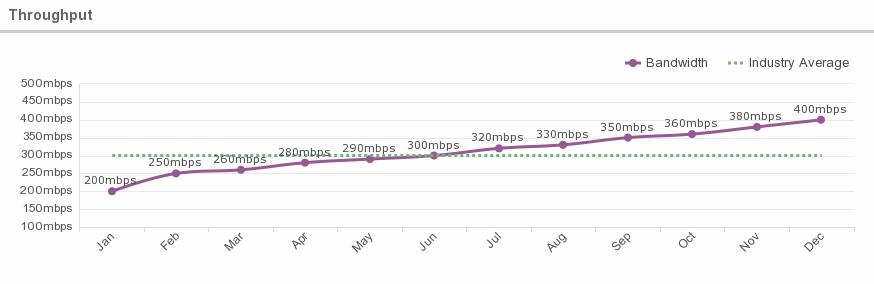
Average Throughputs
According to IT blogger Phillip Kent, it is common for cloud providers to offer throughputs of around 300 Megabits/second, and this may exceed the rate of data transfer required by the software application.
Why is this metric important?
Adequate throughput is important to ensure all applications run with optimal efficiency. There are applications where throughput is a critical factor: anything involving video data, scientific data, data being streamed by ‘Internet of things’ devices, or ‘real time’ big data systems.
6. Capacity
What is this metric?
Capacity is the size of the workload compared to available infrastructure.
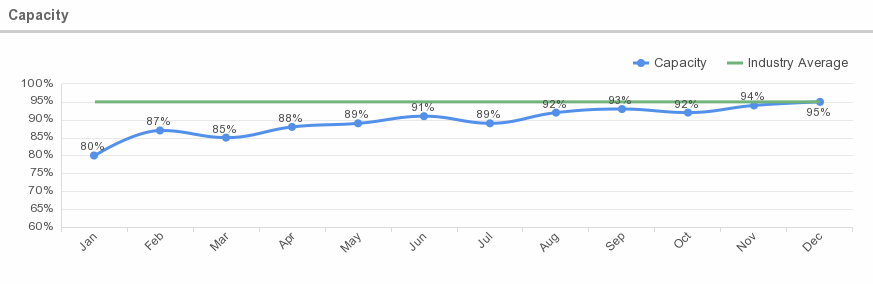
Average Capacity
According to IBM, capacity requirements can be calculated by tracking average utilization over time of workloads with varying demand, and working from the mean to find the capacity to handle 95% of all workloads.
Why is this metric important?
Capacity is important in order to balance supply and demand. This indicator can be very useful since thus it can be defined how much memory must always be at minimum available on the system.
In the cloud model, any request for services needs to be checked and filtered to ensure the capacity is available to actually deliver the required service.
7. Scalability
What is this metric?
Degree to which the service or system can support a defined growth scenario. Scalability refers to the ability to service a theoretical number of users. Web-based applications (called Cloud Computing) are often mentioned as scalable up to tens of thousands, hundreds of thousands, millions, or even more, simultaneous users. That means that at full capacity (usually marked as 80%), the system can handle that many users without failure to any user or without crashing as a whole because of resource exhaustion. The better an application’s scalability, the more users it can handle simultaneously.
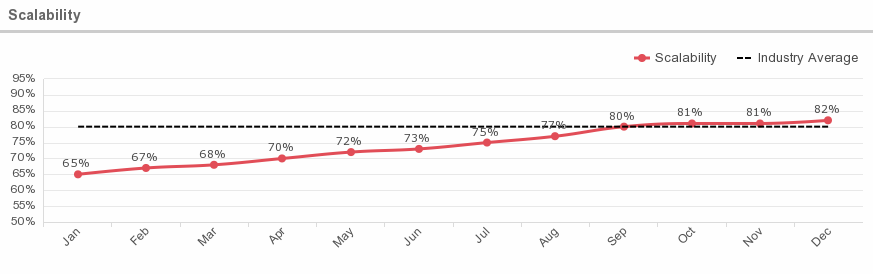
Why is this metric important?
Scalability is important to evaluate in order to determine whether a system can handle a large number of application requests simultaneously. The ability to scale resources is an essential part of the elasticity provided by Cloud computing. However, this metric is more applicable from the performance perspective of user applications.
8. Latency
What is this metric?
This metric shows the time interval between submitting a packet and arrival at its destination.

Average Network Latency
According to Verizon Enterprise, the average network latency in North America is about 36 milliseconds, but trans-Atlantic latency between the U.S. and Europe is about 73 milliseconds.
Why is this metric important?
Latency greatly affects how usable and enjoyable devices and communications are. Those problems can be magnified for cloud service communications, which can be especially prone to latency. In addition, latency in the cloud environment is less predictable and more complicated to measure.
9. Service and Helpdesk
What is this metric?
This metric tracks the times at which assistance is provided, which support methods are applied or how many calls are received per week, as well as the duration of the support instance.
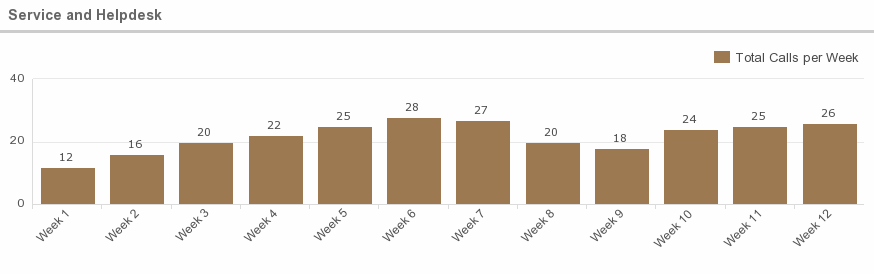
Why is this metric important?
This information is helpful in analyzing the performance of the system, as well as providing feedback about the capability of the helpdesk personnel.
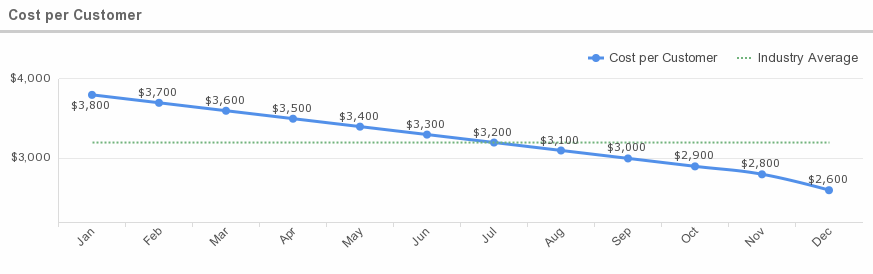
10. Cost per customer
What is this metric?
This measures how much it costs to deploy the cloud for each customer. The recurring cost of all engineering, support, account management, customer service, and billing activities plus all physical infrastructure and systems required to maintain a current customer, including fully loaded labor costs, usually quoted as an average unit cost per current customer.
Average Cost per Customer
Chaotic Flow’s formula for determining Average Cost of Service (per customer), or ACS, for SaaS companies is demonstrated as such:
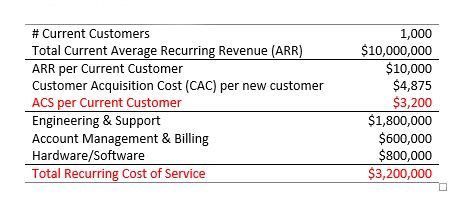
Why is this metric important?
Initially, this will help determine pricing plans (i.e. Fixed Recurring Pricing, Variable Pricing by Resource Consumption, Variable Pricing by Time, etc.), and is necessary as an ongoing tool for measuring profitability.
Share this Post