
The Insurance Industry’s
18 Most Critical Metrics
Share this Post
The article does not include metrics such as Profits and Sales that are critical to companies in all industries; rather the focus is on metrics more specific to the Insurance Industry.
By tracking your metrics, you will dramatically improve your business results.
Why? Because not only is the old saying “If you can’t measure it, you can’t improve it” true, but visibility into your metrics allows you to identify WHERE you can make the easiest and most impactful improvements.
For each metric, we will answer the following questions:
– What is the metric?
– What is the average value of this metric?
– Why is this metric important?
Let’s get started…
1. Revenue per policyholder
What is this metric?
Revenue per Policyholder is a simple key performance indicator (KPI) that measures the amount of revenue generated by the insurance company, per policyholder serviced.
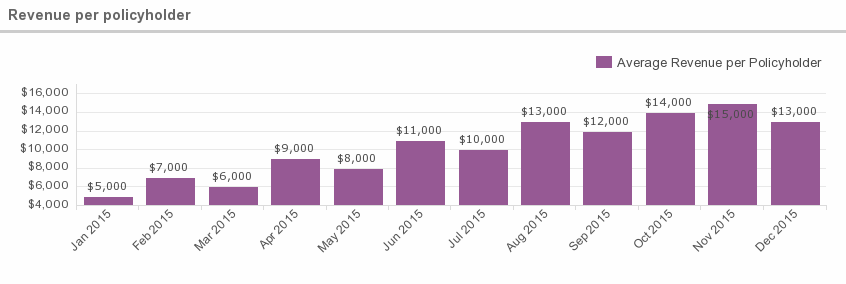
Why is this metric important?
A low, or lagging, value for this KPI could be due to several factors: poor agency and online sales, sub-par in-force customer service (which leads to low retention rate), or a lack of sound investment practices could all contribute to below average revenue generation. Look to improve your distribution strategy and investment activities to beef up company earnings.
2. Average cost per claim
What is this metric?
The Average Cost per Claim KPI measures how much your organization pays out for each claim filed by your customers. With this KPI (as with other insurance KPIs), it’s important to categorize based on the type of claim, since each type of claim will differ in cost.
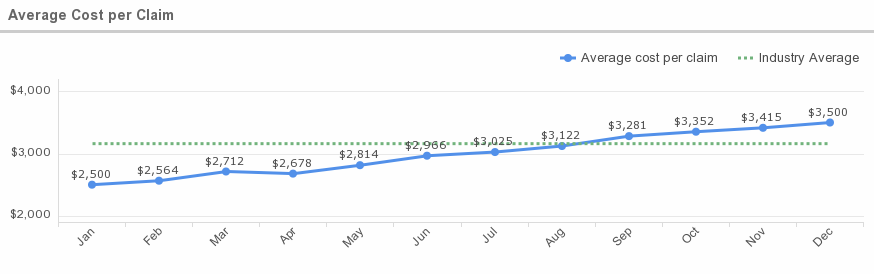
Average value
According to Verisk Analytics, the average auto collision claim is $3,160, while the Insurance Research Council found that the average homeowner’s insurance claim is $626.
Why is this metric important?
The purpose of this KPI is to help your organization to properly assess the risk associated with each type of policy and adjust policy pricing accordingly.
3. Average time to settle a claim
What is this metric?
The Average Time to Settle a Claim KPI measures how long it takes – on average – to settle insurance claims for each type of policy your organization offers. Each insurance policy will have different claim periods, and may vary quite a bit in terms of how long it takes to settle that particular claim.
Calculation: Total Number of Days taken to settle all claims (in each insurance claim category) / Total Claims
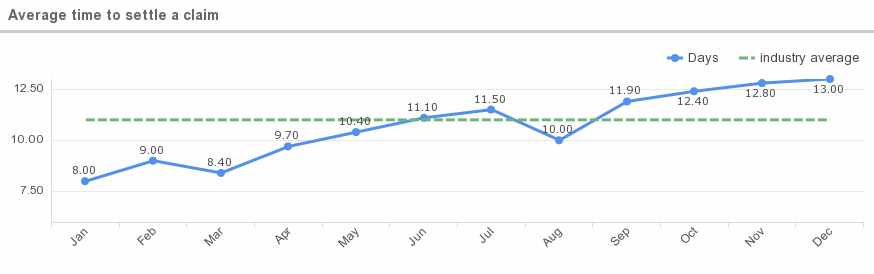
Average Value
According to a recent J.D. Power & Associates Property Claims Satisfaction Study, claim cycle time is the leading indicator of customer satisfaction. The study reported Amica as the insurer with the shortest claim cycle, at an average of 11 days.
Why is this metric important?
Keeping claim cycle time low is important in customer retention. Track this KPI to keep cycle time contained.
4. Return on surplus
What is this metric?
The return on policyholder surplus shows how much profit an insurance company can bring in relative to the amount of revenue it generates from underwriting insurance policies and investing proceeds, with policyholder surplus representing how much an insurer’s assets exceed its liabilities.
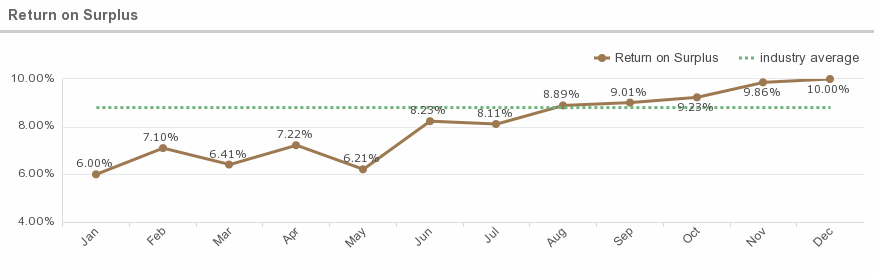
Average Value
According to the National Association of Insurance Commissioners, the average return on surplus across all lines of insurance is 8.8%.
Why is this metric important?
This KPI monitors a company’s profit performance.
5. Loss ratio
What is this metric?
The total amount of claims paid out to policyholders by the insurance company as a percentage of total premium earned over the same time period.
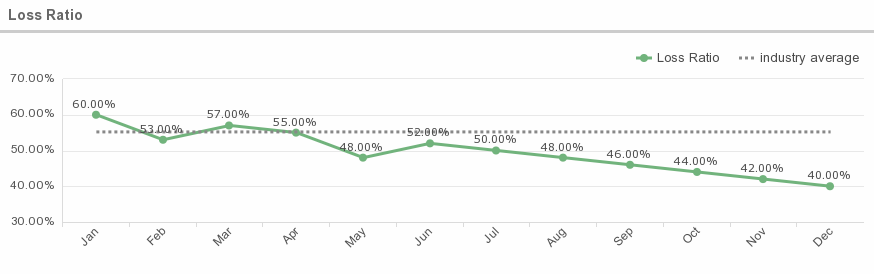
Average Value
According to the National Association of Insurance Commissioners, the average losses incurred across all lines of insurance is 55.2%.
Why is this metric important?
This is an indicator of how well an insurance company is doing. This ratio reflects if companies are collecting premiums higher than the amount paid in claims or if it is not collecting enough premiums to cover claims. Companies that have high loss claims may be experiencing financial trouble.
6. Frequency
What is this metric?
Frequency is a measure of the number of claims that are expected based on exposure.
The likelihood that a loss will occur. Expressed as low frequency (meaning the loss event is possible, but the event has rarely happened in the past and is not likely to occur in the future), moderate frequency (meaning the loss event has happened once in a while and can be expected to occur sometime in the future), or high frequency (meaning the loss event happens regularly and can be expected to occur regularly in the future).
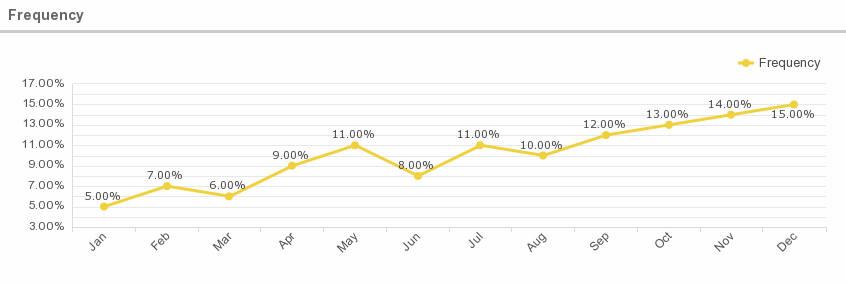
Average Value
According to International Risk Management Institute, workers compensation losses normally have a high frequency as do automobile collision losses. General liability losses are usually of a moderate frequency, and property losses often have a low frequency.
Why is this metric important?
Frequency is important to measure in order to determine the likelihood of paying out claims, and subsequently planning for financial viability. Ratemaking activity depends on this metric.
7. Severity
What is this metric?
Severity refers to the cost of a claim, with high severity claims being more expensive than average estimates and low severity claims being less expensive than the average. The average cost of claims may be estimated based off of historical cost figures.

Why is this metric important?
This is an important metric for forecasting a company’s ability to pay claims, which affects its overall financial health. This is one of the bases for ratemaking.
8. Components of claim costs
What is this metric?
This metric tracks the costs involved with significant controllable elements of claims, such as legal costs, report delays, and time to settle.
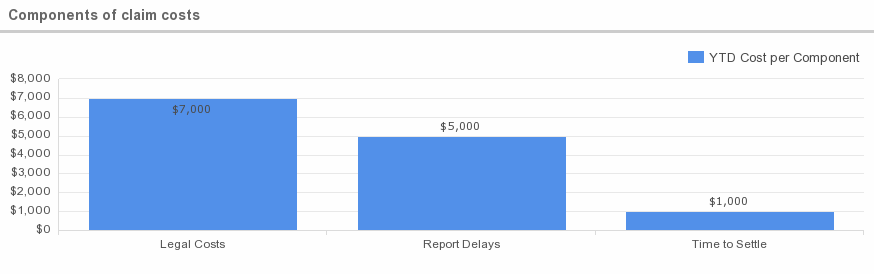
Why is this metric important?
This metric is important for tracking operational efficiency and minimizing costs.
9. Expense ratio
What is this metric?
The ratio of firm-wide expenses (before interest) to total amount of premiums earned over the same time period.
The percentage of premium used to pay all the costs of acquiring, writing, and servicing insurance and reinsurance.
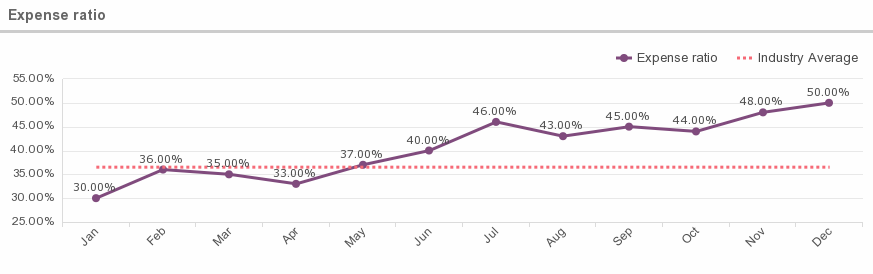
Average value
According to Vertafore, the industry average expense ratio is 36.5%.
Why is this metric important?
A company’s ability to effectively track and control expenses is crucial to its survival, especially in a soft economy.
Expense ratios are also an integral part of retrospective rating basic premiums.
10. Renewal/retention
What is this metric?
This measures the number of customers who continue coverage after the initial term has expired.
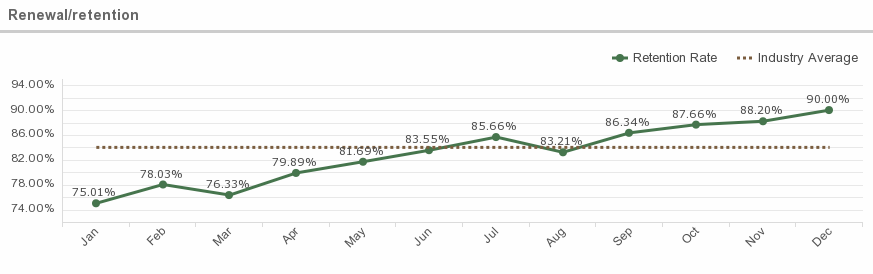
Average Value
According to an article posted by The Independent Insurance Agents of Dallas, the average customer retention rate within the insurance industry is 84%.
Why is this metric important?
Retention is very cost effective. Many studies have shown that $1 paid towards customer retention increases profits by more than $5 spent on new customer acquisition.
11. Sales or new business
What is this metric?
This metric tracks the number of new insurance policies onboarded. This can be tracked by product line and/or by agent over a defined period of time.

Why is this metric important?
This is an important indicator of operational performance, and can be instrumental in strategy development and/or employee evaluation.
12. Strike rate
What is this metric?
Measures of the quality of new business that agents or brokerages are bringing to the company and reflect the underwriting acceptance rate.
Strike rates reflect the effectiveness of new business production efforts. They can be examined across five key metrics: percentage bound, percentage pending, percentage declined, percentage lost and percentage closed. Collectively, these metrics add up to one hundred percent of the business.
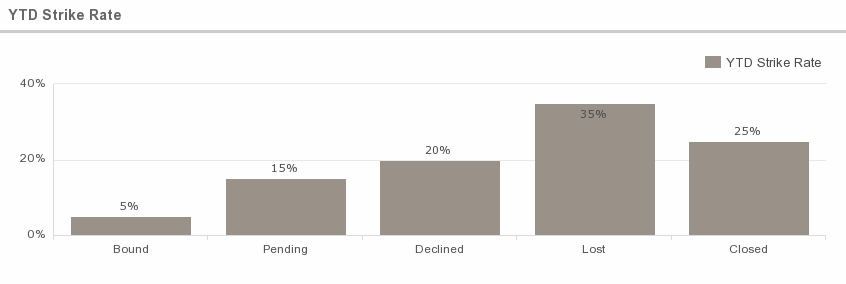
Why is this metric important?
If a target strike rate for closed business is established, evaluating strike rates by broker is a particularly powerful measure of their performance.
13. Quota vs. production
What is this metric?
Measures the effectiveness of sales agents at meeting sales targets. Within the insurance world, there are typically two types of insurance sellers. The first group work exclusively for your organization, and only sell your products (often called captive agents). The second group works for a third-party and sell policies for a number of companies, ostensibly finding the best rate for clients (non-captive).
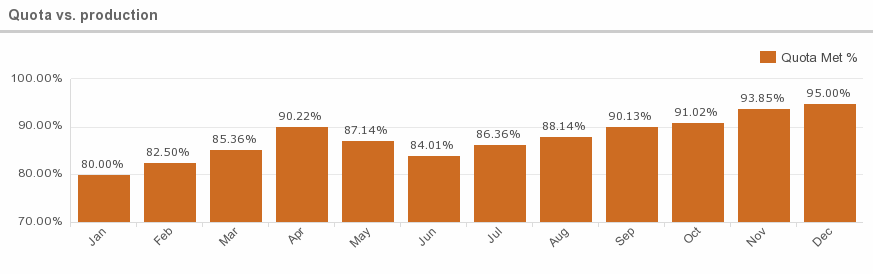
Why is this metric important?
Setting realistic quotas that challenge your team and don’t discourage them is essential for achieving a high quota to production ratio.
14. Average policy size
What is this metric?
This is the size or price of all policies sold in a given time frame divided by the number of policies sold.
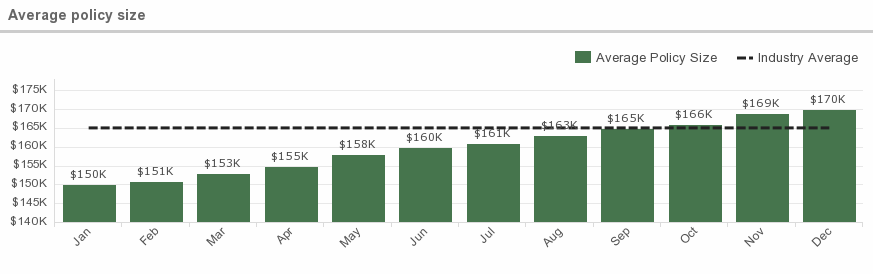
Average value
ACLI reports the average size of an individual life insurance policy is $165,000.
Why is this metric important?
This metric helps determine operational excellence. It is helpful in evaluating whether the company is achieving a product risk profile that matches its strategy.
15. Underwriting speed
What is this metric?
Number of business days within which the underwriting decision should be made as defined by the company’s service level agreement (SLA).
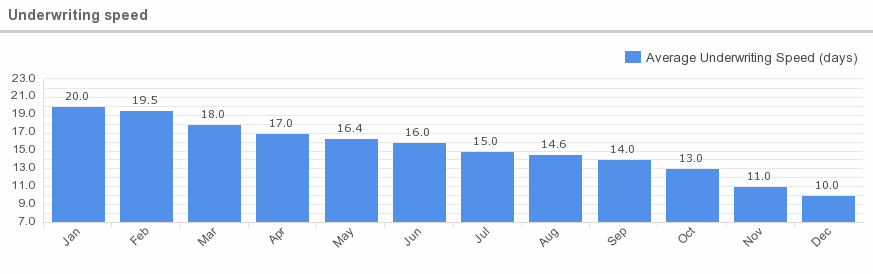
Why is this metric important?
Speed of approval is important for customer satisfaction, but also for agent and agency success. A faster approval time means more revenue coming in.
16. Number of referrals
What is this metric?
This measures how many new clients were referred by existing clients.
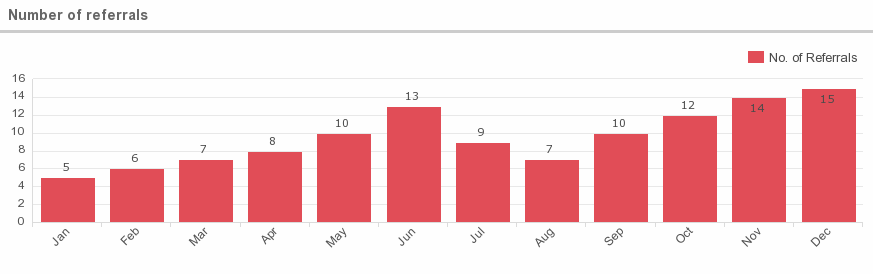
Why is this metric important?
This measures how many new clients were referred by existing clients.
17. Average cost per claim
What is this metric?
Measures how much your organization pays out for each claim filed by your customers.
Average value
According to Capgemini, insurers spend more than US$330 billion each year in managing and settling claims worldwide. This accounts for 70 to 75 percent of an average insurer’s combined ratio.
Why is this metric important?
This metric helps track a company’s financial performance, as well as being one of the bases for ratemaking.
18. Policy sales growth
What is this metric?
Measures how many new policies your organization has sold over a set period of time and compares that to a target value. The policy sales growth can be defined based on the number of new clients, a measure of number of new policies sold, or a combination of the two.
It is calculated by dividing the difference between the current period’s sales revenue and the previous period’s sales revenue, and then dividing that difference by the previous period’s sales revenue.
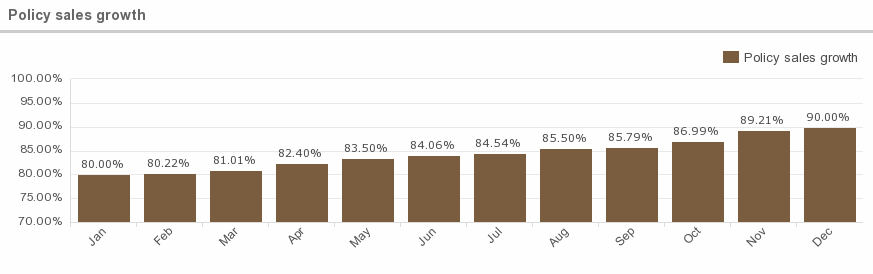
Why is this metric important?
Higher policy growth equals higher sales.
This KPI is designed to provide you with a view of the big picture, and even if you use this insurance KPI to monitor a shorter time-frame, it’s important to compare current values to historical norms. Use this insurance KPI to determine if you’re hitting sales targets.
Share this Post